
When you plug in a controller, you mash buttons, move the sticks, pull the triggers… and as a developer, you see none of it. The browser’s picking it up, sure, but unless you’re logging numbers in the console, it’s invisible. That’s the headache with the Gamepad API.
It’s been around for years, and it’s actually pretty powerful. You can read buttons, sticks, triggers, the works. But most people don’t touch it. Why? Because there’s no feedback. No panel in developer tools. No clear way to know if the controller’s even doing what you think. It feels like flying blind.
That bugged me enough to build a little tool: Gamepad Cascade Debugger. Instead of staring at console output, you get a live, interactive view of the controller. Press something and it reacts on the screen. And with CSS Cascade Layers, the styles stay organized, so it’s cleaner to debug.
In this post, I’ll show you why debugging controllers is such a pain, how CSS helps clean it up, and how you can build a reusable visual debugger for your own projects.
By the end, you’ll know how to:
- Spot the tricky parts of debugging controller input.
- Use Cascade Layers to tame messy CSS.
- Build a live Gamepad debugger.
- Add extra functionalities like recording, replaying, and taking snapshots.
Alright, let’s dive in.
Why Debugging Gamepad Input Is Hard
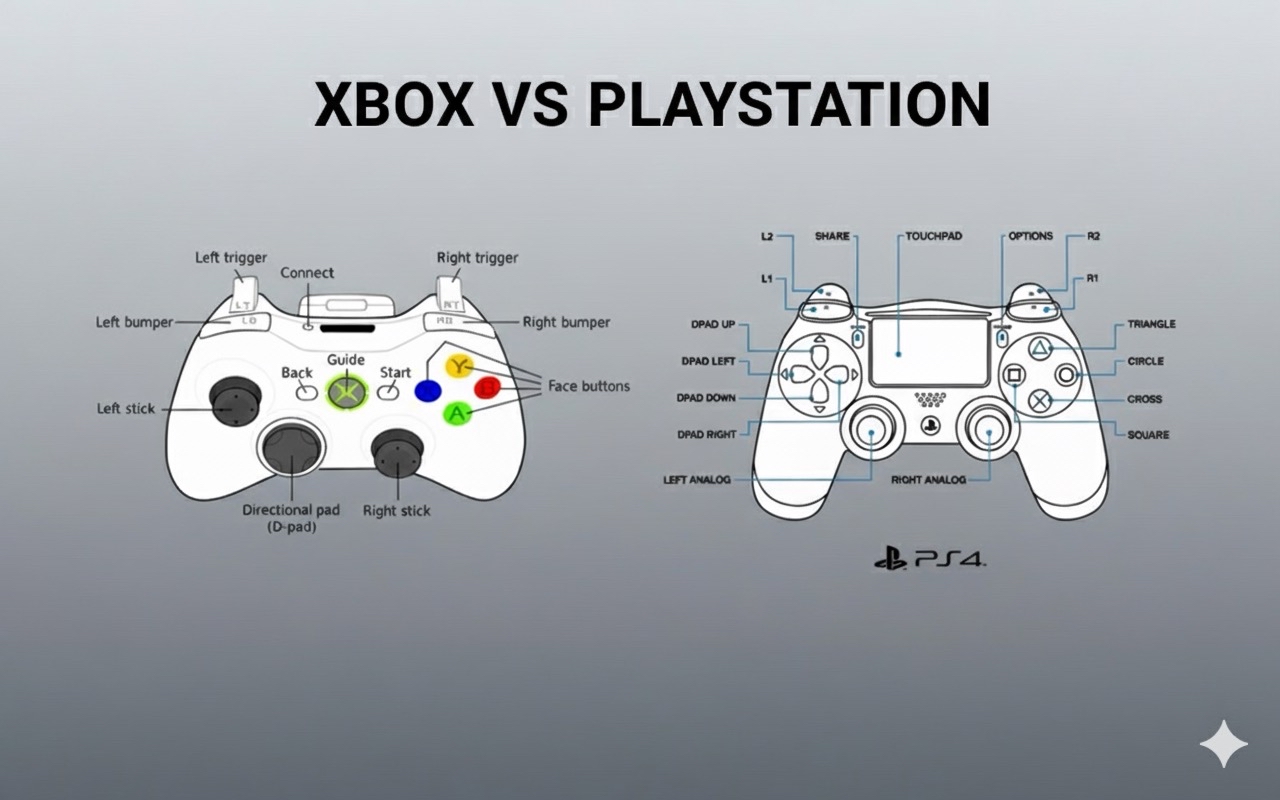
Just the thought of building a game or web app where a player uses a controller instead of a mouse could make you nervous. You need to be able to respond to actions like:
- Did they press
AorB? - Is the joystick tilted halfway or fully?
- How hard is the trigger pulled?
The Gamepad API exposes and displays all of the information you need, but only as arrays of numbers. Each button has a value (e.g., 0 for not pressed, 1 for fully pressed, and decimals for pressure-sensitive triggers), and each joystick reports its position on the X and Y axes.
Here’s what it looks like in raw form:
// Example: Reading the first connected gamepad
const gamepad = navigator.getGamepads()[0];

console.log(gamepad.buttons.map(b => b.value));
// [0, 0, 1, 0, 0, 0.5, 0, ...]

console.log(gamepad.axes);
// [-0.24, 0.98, -0.02, 0.00]
Is it useful? Technically, yes. Easy to debug? Not at all.
Problem 1: Invisible State
When you press a physical button, you feel the click, right? But in your code, nothing moves on screen unless you manually wire up a display. Unlike keyboard events (which show in browser dev tools) or mouse clicks (which fire visible events), gamepad input has no built-in visual feedback.
To illustrate the difference, here’s how other input methods give you immediate feedback:
// Keyboard events are visible and easy to track
document.addEventListener('keydown', (e) => {
  console.log('Key pressed:', e.key);
  // Outputs: "Key pressed: a"
  // You can see this in DevTools, and many tools show keyboard input
});

// Mouse clicks provide clear event data
document.addEventListener('click', (e) => {
  console.log('Clicked at:', e.clientX, e.clientY);
  // Outputs: "Clicked at: 245, 389"
  // Visual feedback is immediate
});

// But gamepad input? Silent and invisible.
const gamepad = navigator.getGamepads()[0];
if (gamepad) {
  console.log(gamepad.buttons[0]);
  // Outputs: GamepadButton {pressed: false, touched: false, value: 0}
  // No events, no DevTools panel, just polling
}
The gamepad doesn’t fire events when buttons are pressed. You have to constantly poll it using requestAnimationFrame, checking values manually. There’s no built-in visualization, no dev tools integration, nothing.
This forces you to keep going back and forth between your console and your controller just to keep logging values, interpreting numbers, and mentally mapping them back to physical actions.
Problem 2: Too Many Inputs
A modern controller can have up to 15+ buttons and 4+ axes. That’s over a dozen values updating at once.
Even if you are able to log them all, you’ll quickly end up with unreadable console spam. For example:
[0,0,1,0,0,0.5,0,...]
[0,0,0,0,1,0,0,...]
[0,0,1,0,0,0,0,...]
Can you tell what button was pressed? Maybe, but only after straining your eyes and missing a few inputs. So, no, debugging doesn’t come easily when it comes to reading inputs.
Problem 3: Lack Of Structure
Even if you throw together a quick visualizer, styles can quickly get messy. Default, active, and debug states can overlap, and without a clear structure, your CSS becomes brittle and hard to extend.
CSS Cascade Layers can help. They group styles into “layers” that are ordered by priority, so you stop fighting specificity and guessing, “Why isn’t my debug style showing?” Instead, you maintain separate concerns:
- Base: The controller’s standard, initial appearance.
- Active: Highlights for pressed buttons and moved sticks.
- Debug: Overlays for developers (e.g., numeric readouts, guides, and so on).
If we were to define layers in CSS according to this, we’d have:
/* lowest to highest priority */
@layer base, active, debug;

@layer base {
  /* ... */
}

@layer active {
  /* ... */
}

@layer debug {
  /* ... */
}
Because each layer stacks predictably, you always know which rules win. That predictability makes debugging not just easier, but actually manageable.
We’ve covered the problem (invisible, messy input) and the approach (a visual debugger built with Cascade Layers). Now we’ll walk through the step-by-step process to build the debugger.
The Debugger Concept
The easiest way to make hidden input visible is to just draw it on the screen. That’s what this debugger does. Buttons, triggers, and joysticks all get a visual.
- Press
A: A circle lights up. - Nudge the stick: The circle slides around.
- Pull a trigger halfway: A bar fills halfway.
Now you’re not staring at 0s and 1s, but actually watching the controller react live.
Of course, once you start piling on states like default, pressed, debug info, maybe even a recording mode, the CSS starts getting larger and more complex. That’s where cascade layers come in handy. Here’s a stripped-down example:
@layer base {
  .button {
    background: #222;
    border-radius: 50%;
    width: 40px;
    height: 40px;
  }
}

@layer active {
  .button.pressed {
    background: #0f0; /* bright green */
  }
}

@layer debug {
  .button::after {
    content: attr(data-value);
    font-size: 12px;
    color: #fff;
  }
}
The layer order matters: base → active → debug.
basedraws the controller.activehandles pressed states.debugthrows on overlays.
Breaking it up like this means you’re not fighting weird specificity wars. Each layer has its place, and you always know what wins.
Building It Out
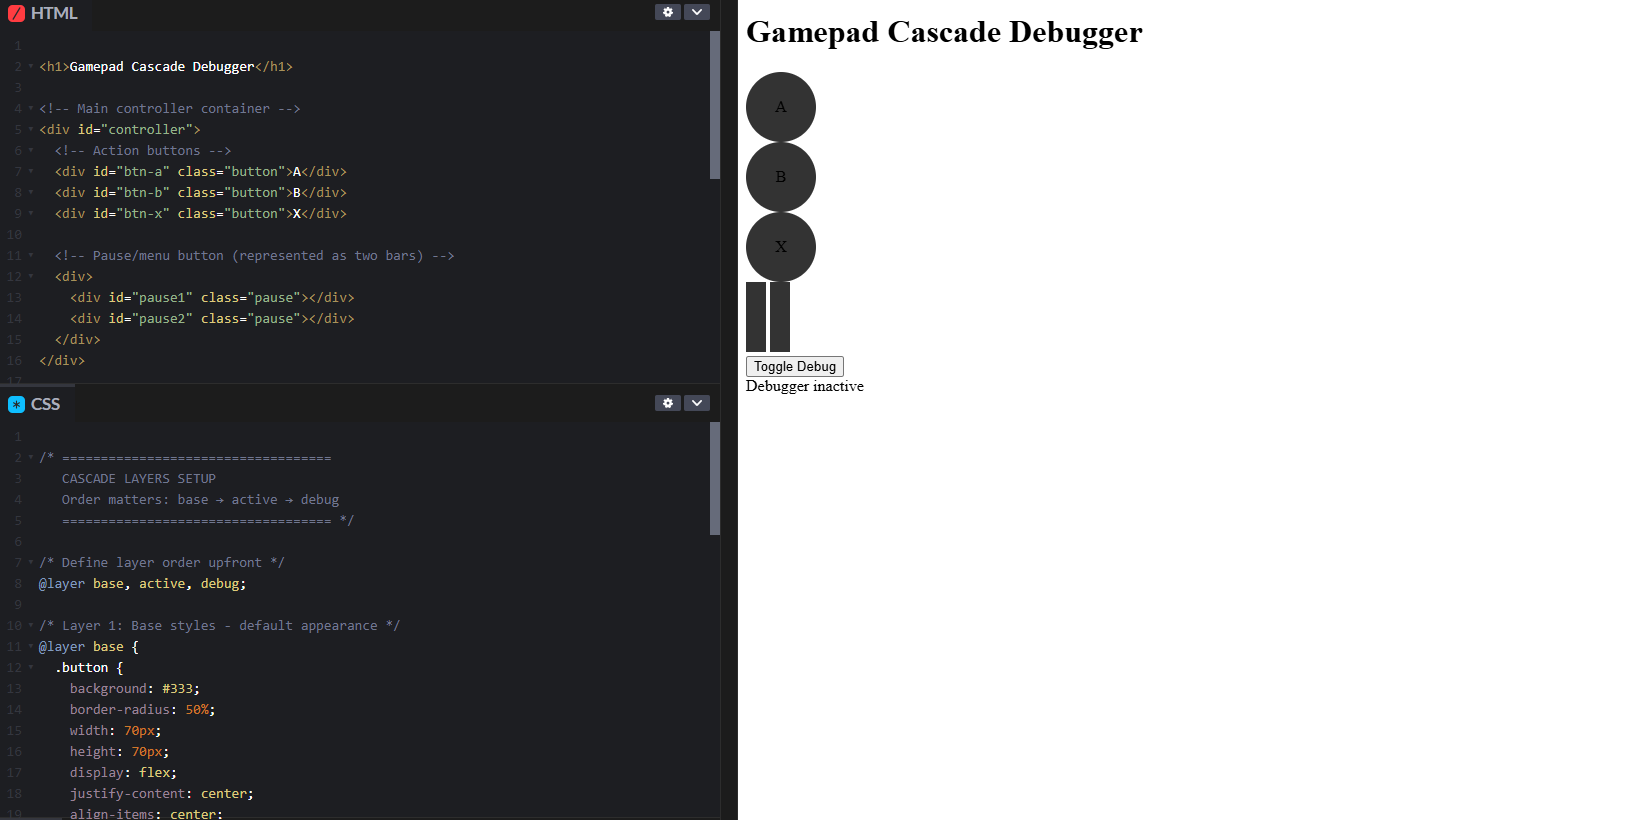
Let’s get something on screen first. It doesn’t need to look good — just needs to exist so we have something to work with.
Debugger inactive
That’s literally just boxes. Not exciting yet, but it gives us handles to grab later with CSS and JavaScript.
Okay, I’m using cascade layers here because it keeps stuff organized once you add more states. Here’s a rough pass:
/* ===================================
   CASCADE LAYERS SETUP
   Order matters: base → active → debug
   =================================== */

/* Define layer order upfront */
@layer base, active, debug;

/* Layer 1: Base styles - default appearance */
@layer base {
  .button {
    background: #333;
    border-radius: 50%;
    width: 70px;
    height: 70px;
    display: flex;
    justify-content: center;
    align-items: center;
  }

  .pause {
    width: 20px;
    height: 70px;
    background: #333;
    display: inline-block;
  }
}

/* Layer 2: Active states - handles pressed buttons */
@layer active {
  .button.active {
    background: #0f0; /* Bright green when pressed */
    transform: scale(1.1); /* Slightly enlarges the button */
  }

  .pause.active {
    background: #0f0;
    transform: scaleY(1.1); /* Stretches vertically when pressed */
  }
}

/* Layer 3: Debug overlays - developer info */
@layer debug {
  .button::after {
    content: attr(data-value); /* Shows the numeric value */
    font-size: 12px;
    color: #fff;
  }
}
The beauty of this approach is that each layer has a clear purpose. The base layer can never override active, and active can never override debug, regardless of specificity. This eliminates the CSS specificity wars that usually plague debugging tools.
Now it looks like some clusters are sitting on a dark background. Honestly, not too bad.
Adding the JavaScript
JavaScript time. This is where the controller actually does something. We’ll build this step by step.
Step 1: Set Up State Management
First, we need variables to track the debugger’s state:
// ===================================
// STATE MANAGEMENT
// ===================================

let running = false; // Tracks whether the debugger is active
let rafId; // Stores the requestAnimationFrame ID for cancellation
These variables control the animation loop that continuously reads gamepad input.
Step 2: Grab DOM References
Next, we get references to all the HTML elements we’ll be updating:
// ===================================
// DOM ELEMENT REFERENCES
// ===================================

const btnA = document.getElementById("btn-a");
const btnB = document.getElementById("btn-b");
const btnX = document.getElementById("btn-x");
const pause1 = document.getElementById("pause1");
const pause2 = document.getElementById("pause2");
const status = document.getElementById("status");
Storing these references up front is more efficient than querying the DOM repeatedly.
Step 3: Add Keyboard Fallback
For testing without a physical controller, we’ll map keyboard keys to buttons:
// ===================================
// KEYBOARD FALLBACK (for testing without a controller)
// ===================================

const keyMap = {
  "a": btnA,
  "b": btnB,
  "x": btnX,
  "p": [pause1, pause2] // 'p' key controls both pause bars
};
This lets us test the UI by pressing keys on a keyboard.
Step 4: Create The Main Update Loop
Here’s where the magic happens. This function runs continuously and reads gamepad state:
// ===================================
// MAIN GAMEPAD UPDATE LOOP
// ===================================

function updateGamepad() {
  // Get all connected gamepads
  const gamepads = navigator.getGamepads();
  if (!gamepads) return;

  // Use the first connected gamepad
  const gp = gamepads[0];

  if (gp) {
    // Update button states by toggling the "active" class
    btnA.classList.toggle("active", gp.buttons[0].pressed);
    btnB.classList.toggle("active", gp.buttons[1].pressed);
    btnX.classList.toggle("active", gp.buttons[2].pressed);

    // Handle pause button (button index 9 on most controllers)
    const pausePressed = gp.buttons[9].pressed;
    pause1.classList.toggle("active", pausePressed);
    pause2.classList.toggle("active", pausePressed);

    // Build a list of currently pressed buttons for status display
    let pressed = [];
    gp.buttons.forEach((btn, i) => {
      if (btn.pressed) pressed.push("Button " + i);
    });

    // Update status text if any buttons are pressed
    if (pressed.length > 0) {
      status.textContent = "Pressed: " + pressed.join(", ");
    }
  }

  // Continue the loop if debugger is running
  if (running) {
    rafId = requestAnimationFrame(updateGamepad);
  }
}
The classList.toggle() method adds or removes the active class based on whether the button is pressed, which triggers our CSS layer styles.
Step 5: Handle Keyboard Events
These event listeners make the keyboard fallback work:
// ===================================
// KEYBOARD EVENT HANDLERS
// ===================================

document.addEventListener("keydown", (e) => {
  if (keyMap[e.key]) {
    // Handle single or multiple elements
    if (Array.isArray(keyMap[e.key])) {
      keyMap[e.key].forEach(el => el.classList.add("active"));
    } else {
      keyMap[e.key].classList.add("active");
    }
    status.textContent = "Key pressed: " + e.key.toUpperCase();
  }
});

document.addEventListener("keyup", (e) => {
  if (keyMap[e.key]) {
    // Remove active state when key is released
    if (Array.isArray(keyMap[e.key])) {
      keyMap[e.key].forEach(el => el.classList.remove("active"));
    } else {
      keyMap[e.key].classList.remove("active");
    }
    status.textContent = "Key released: " + e.key.toUpperCase();
  }
});
Step 6: Add Start/Stop Control
Finally, we need a way to toggle the debugger on and off:
// ===================================
// TOGGLE DEBUGGER ON/OFF
// ===================================

document.getElementById("toggle").addEventListener("click", () => {
  running = !running; // Flip the running state

  if (running) {
    status.textContent = "Debugger running...";
    updateGamepad(); // Start the update loop
  } else {
    status.textContent = "Debugger inactive";
    cancelAnimationFrame(rafId); // Stop the loop
  }
});
So yeah, press a button and it glows. Push the stick and it moves. That’s it.
One more thing: raw values. Sometimes you just want to see numbers, not lights.
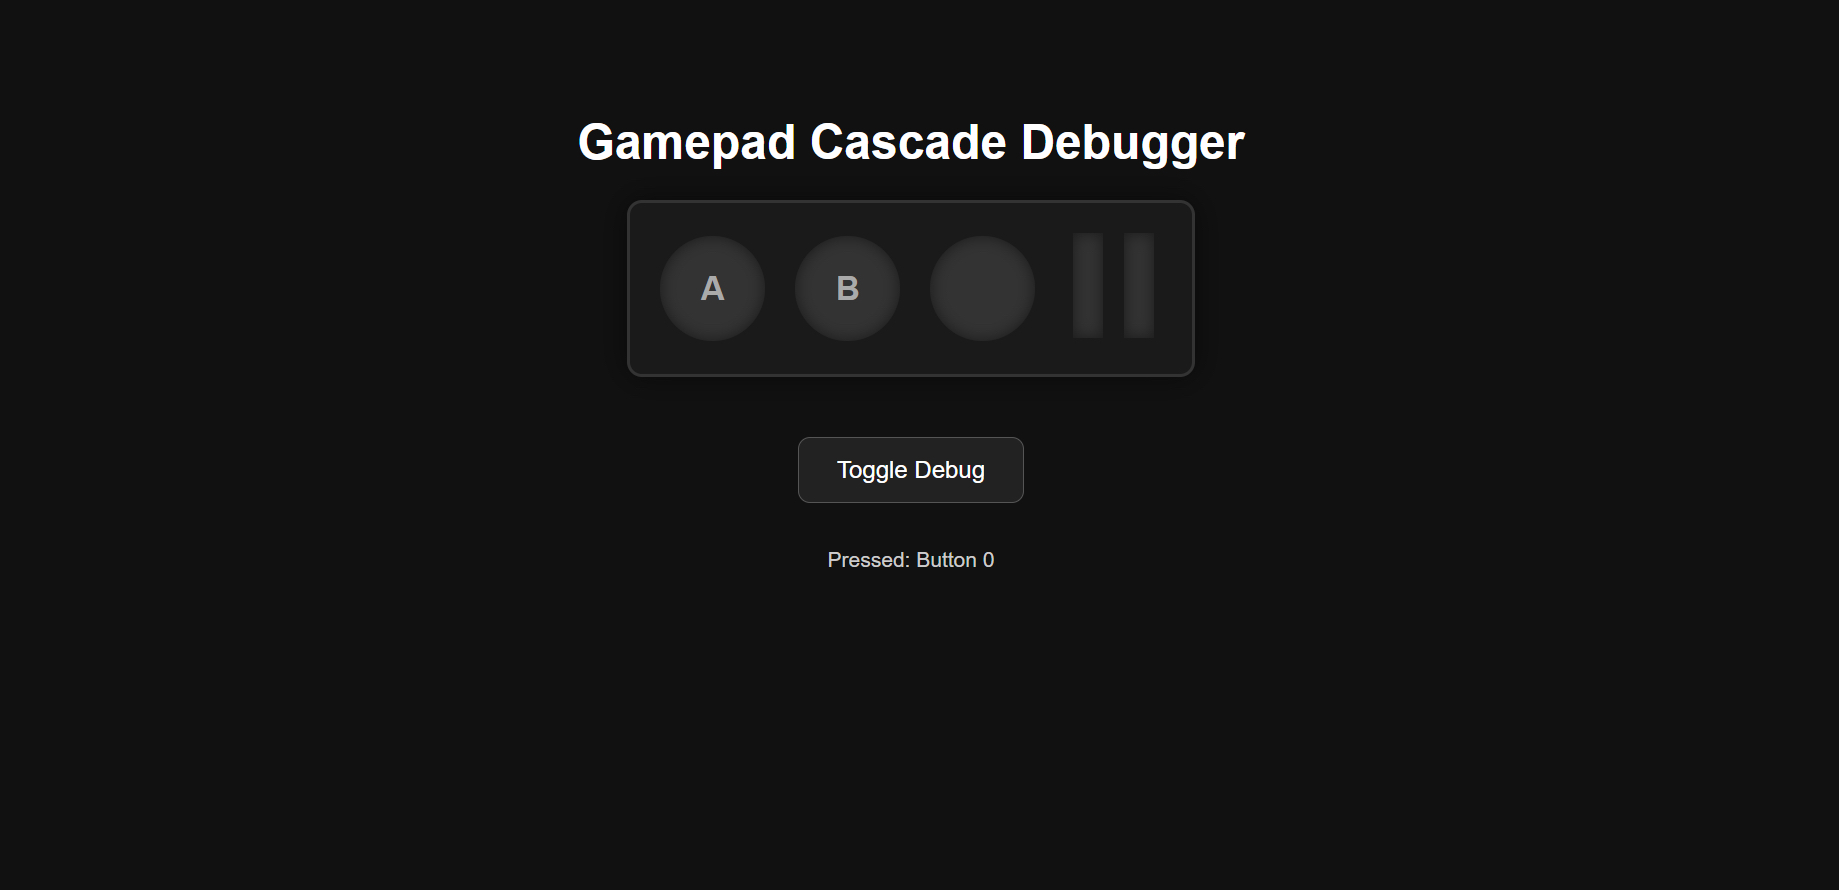
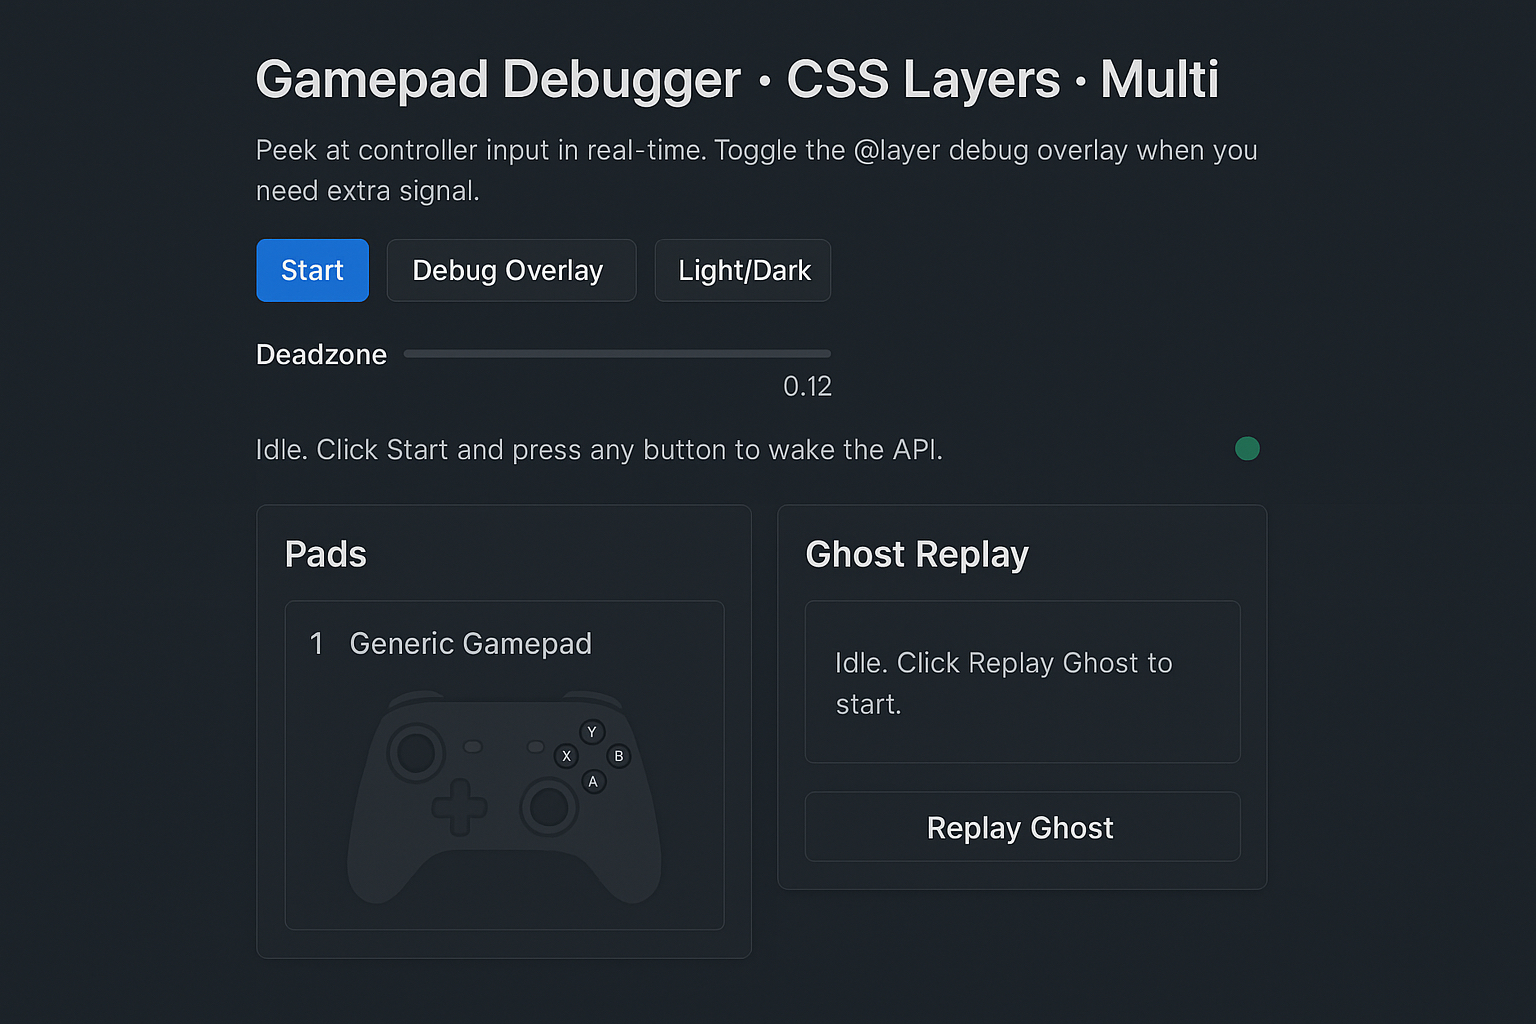
At this stage, you should see:
- A simple on-screen controller,
- Buttons that react as you interact with them, and
- An optional debug readout showing pressed button indices.
To make this less abstract, here’s a quick demo of the on-screen controller reacting in real time:
That’s the whole foundation. From here, we can start layering in extra stuff, like record/replay and snapshots.
A static visualizer is helpful, but we as developers often need more than a snapshot of the controller’s state. We want history, analysis, and replay. Let’s add those layers on top of our debugger.
1. Recording & Stopping Input Logs
We can add two buttons:
Step 1: Set Up Recording State
First, let’s set up the variables we need to track recordings:
// ===================================
// RECORDING STATE
// ===================================

let recording = false; // Tracks if we're currently recording
let frames = []; // Array to store captured input frames

// Get button references
const startBtn = document.getElementById("start-record");
const stopBtn = document.getElementById("stop-record");
The frames array will store snapshots of the gamepad state at each frame, creating a complete timeline of input.
Step 2: Handle Start Recording
When the user clicks “Start Recording,” we initialize a new recording session:
// ===================================
// START RECORDING
// ===================================

startBtn.addEventListener("click", () => {
  frames = []; // Clear any previous recording
  recording = true;

  // Update UI: disable start, enable stop
  stopBtn.disabled = false;
  startBtn.disabled = true;

  console.log("Recording started...");
});
Step 3: Handle Stop Recording
To stop recording, we flip the state back and re-enable the Start button:
// ===================================
// STOP RECORDING
// ===================================

stopBtn.addEventListener("click", () => {
  recording = false;

  // Update UI: enable start, disable stop
  stopBtn.disabled = true;
  startBtn.disabled = false;

  console.log("Recording stopped. Frames captured:", frames.length);
});
Step 4: Capture Frames During Gameplay
Finally, we need to actually capture frames during the update loop. Add this inside the updateGamepad() function:
// ===================================
// CAPTURE FRAMES (add this inside updateGamepad loop)
// ===================================

if (recording && gp) {
  // Store a snapshot of the current gamepad state
  frames.push({
    t: performance.now(), // Timestamp for accurate replay
    buttons: gp.buttons.map(b => ({
      pressed: b.pressed,
      value: b.value
    })),
    axes: [...gp.axes] // Copy the axes array
  });
}
Each frame captures the exact state of every button and joystick at that moment in time.
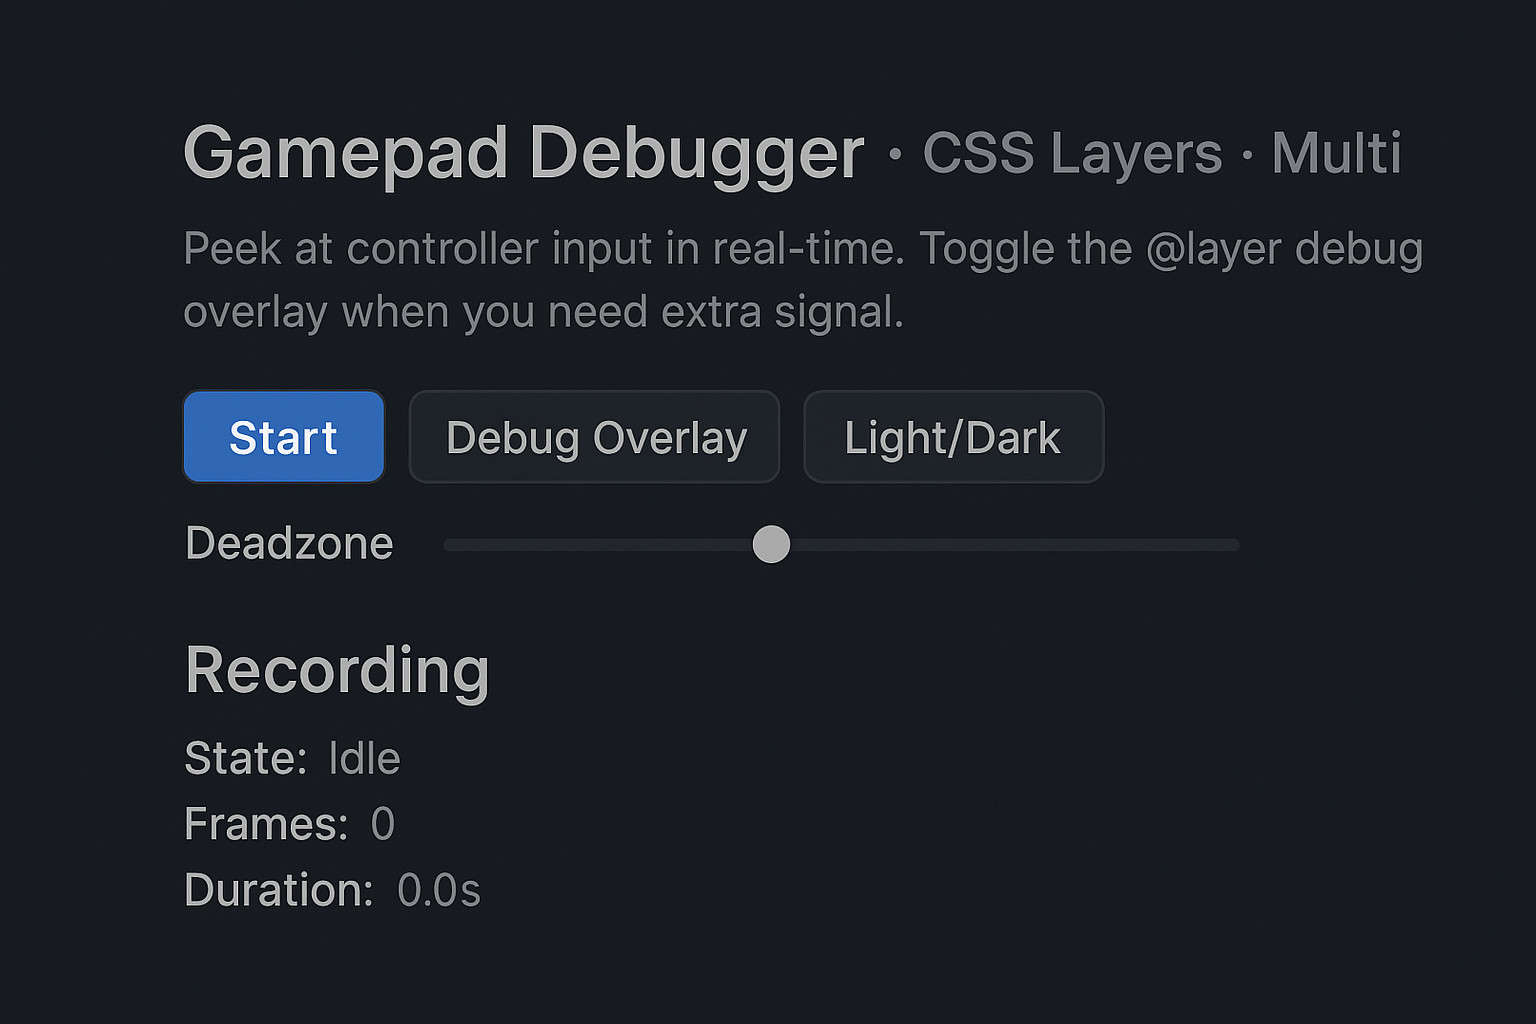
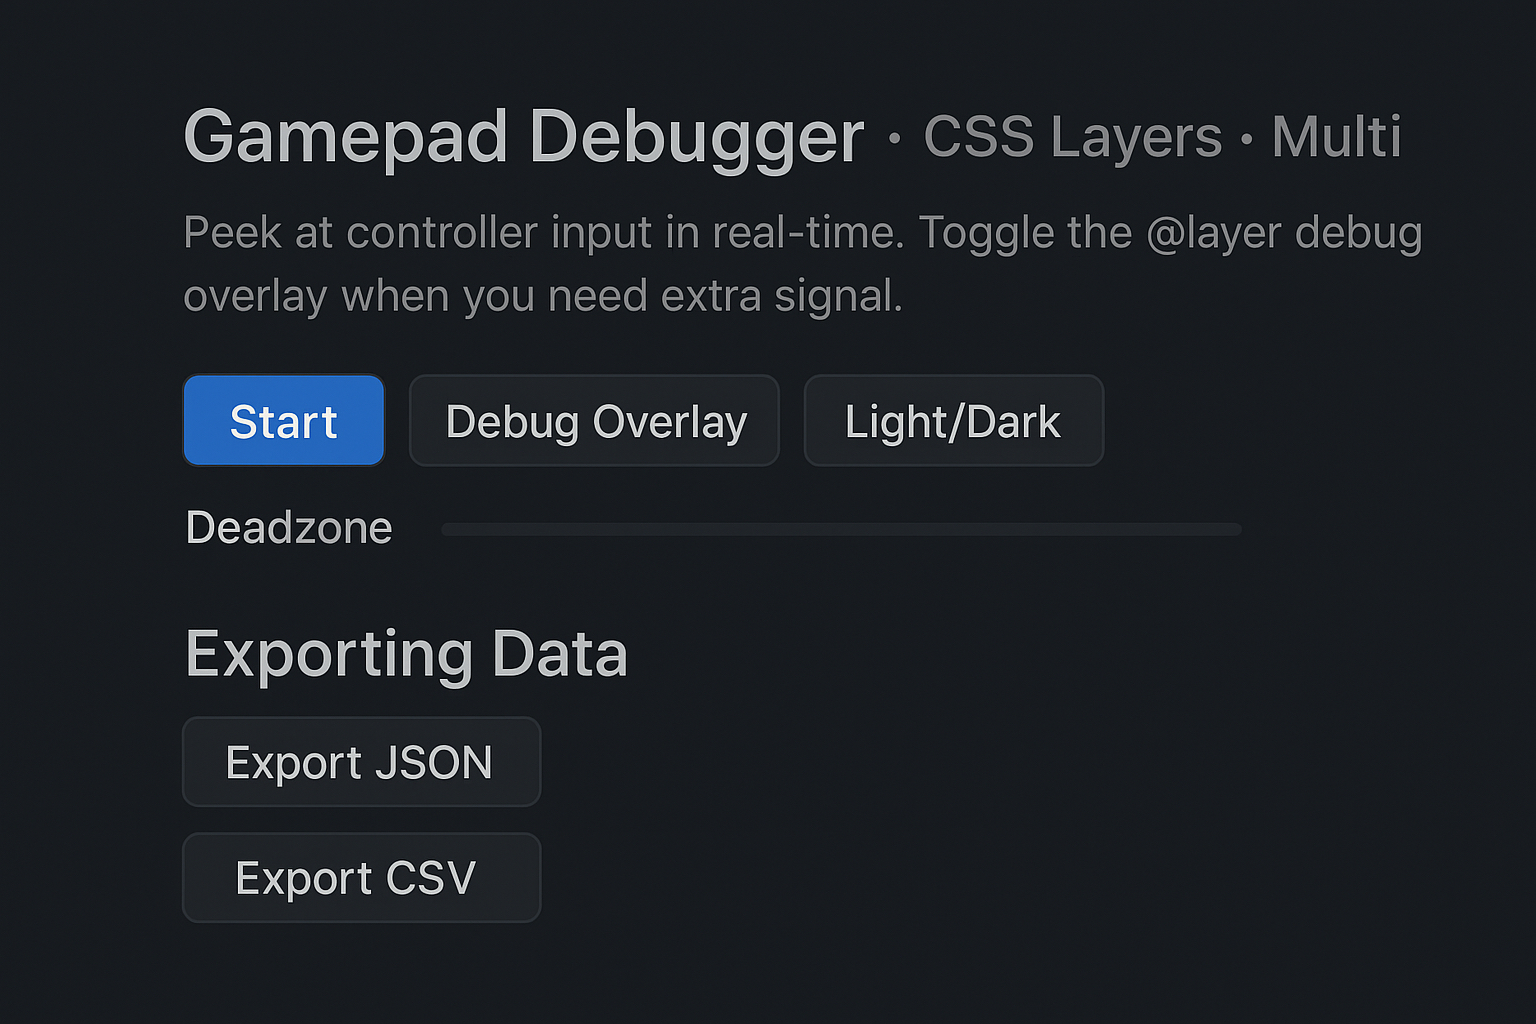
Once wired up, the interface displays a simple recording panel. You get a Start button to begin logging input, while the recording state, frame count, and duration remain at zero until recording begins. The following figure shows the debugger in its initial idle state.
Now, pressing Start Recording logs everything until you hit Stop Recording.
2. Exporting Data to CSV/JSON
Once we have a log, we’ll want to save it.
Step 1: Create The Download Helper
First, we need a helper function that handles file downloads in the browser:
// ===================================
// FILE DOWNLOAD HELPER
// ===================================

function downloadFile(filename, content, type = "text/plain") {
  // Create a blob from the content
  const blob = new Blob([content], { type });
  const url = URL.createObjectURL(blob);

  // Create a temporary download link and click it
  const a = document.createElement("a");
  a.href = url;
  a.download = filename;
  a.click();

  // Clean up the object URL after download
  setTimeout(() => URL.revokeObjectURL(url), 100);
}
This function works by creating a Blob (binary large object) from your data, generating a temporary URL for it, and programmatically clicking a download link. The cleanup ensures we don’t leak memory.
Step 2: Handle JSON Export
JSON is perfect for preserving the complete data structure:
// ===================================
// EXPORT AS JSON
// ===================================

document.getElementById("export-json").addEventListener("click", () => {
  // Check if there's anything to export
  if (!frames.length) {
    console.warn("No recording available to export.");
    return;
  }

  // Create a payload with metadata and frames
  const payload = {
    createdAt: new Date().toISOString(),
    frames
  };

  // Download as formatted JSON
  downloadFile(
    "gamepad-log.json",
    JSON.stringify(payload, null, 2),
    "application/json"
  );
});
The JSON format keeps everything structured and easily parseable, making it ideal for loading back into dev tools or sharing with teammates.
Step 3: Handle CSV Export
For CSV exports, we need to flatten the hierarchical data into rows and columns:
// ===================================
// EXPORT AS CSV
// ===================================

document.getElementById("export-csv").addEventListener("click", () => {
  // Check if there's anything to export
  if (!frames.length) {
    console.warn("No recording available to export.");
    return;
  }

  // Build CSV header row (columns for timestamp, all buttons, all axes)
  const headerButtons = frames[0].buttons.map((_, i) => `btn${i}`);
  const headerAxes = frames[0].axes.map((_, i) => `axis${i}`);
  const header = ["t", ...headerButtons, ...headerAxes].join(",") + "\n";

  // Build CSV data rows
  const rows = frames.map(f => {
    const btnVals = f.buttons.map(b => b.value);
    return [f.t, ...btnVals, ...f.axes].join(",");
  }).join("\n");

  // Download as CSV
  downloadFile("gamepad-log.csv", header + rows, "text/csv");
});
CSV is brilliant for data analysis because it opens directly in Excel or Google Sheets, letting you create charts, filter data, or spot patterns visually.
Now that the export buttons are in, you’ll see two new options on the panel: Export JSON and Export CSV. JSON is nice if you want to throw the raw log back into your dev tools or poke around the structure. CSV, on the other hand, opens straight into Excel or Google Sheets so you can chart, filter, or compare inputs. The following figure shows what the panel looks like with those extra controls.
3. Snapshot System
Sometimes you don’t need a full recording, just a quick “screenshot” of input states. That’s where a Take Snapshot button helps.
And the JavaScript:
// ===================================
// TAKE SNAPSHOT
// ===================================

document.getElementById("snapshot").addEventListener("click", () => {
  // Get all connected gamepads
  const pads = navigator.getGamepads();
  const activePads = [];

  // Loop through and capture the state of each connected gamepad
  for (const gp of pads) {
    if (!gp) continue; // Skip empty slots

    activePads.push({
      id: gp.id, // Controller name/model
      timestamp: performance.now(),
      buttons: gp.buttons.map(b => ({
        pressed: b.pressed,
        value: b.value
      })),
      axes: [...gp.axes]
    });
  }

  // Check if any gamepads were found
  if (!activePads.length) {
    console.warn("No gamepads connected for snapshot.");
    alert("No controller detected!");
    return;
  }

  // Log and notify user
  console.log("Snapshot:", activePads);
  alert(`Snapshot taken! Captured ${activePads.length} controller(s).`);
});
Snapshots freeze the exact state of your controller at one moment in time.
4. Ghost Input Replay
Now for the fun one: ghost input replay. This takes a log and plays it back visually as if a phantom player was using the controller.
JavaScript for replay:
// ===================================
// GHOST REPLAY
// ===================================

document.getElementById("replay").addEventListener("click", () => {
  // Ensure we have a recording to replay
  if (!frames.length) {
    alert("No recording to replay!");
    return;
  }

  console.log("Starting ghost replay...");

  // Track timing for synced playback
  let startTime = performance.now();
  let frameIndex = 0;

  // Replay animation loop
  function step() {
    const now = performance.now();
    const elapsed = now - startTime;

    // Process all frames that should have occurred by now
    while (frameIndex < frames.length && frames[frameIndex].t <= elapsed) {
      const frame = frames[frameIndex];

      // Update UI with the recorded button states
      btnA.classList.toggle("active", frame.buttons[0].pressed);
      btnB.classList.toggle("active", frame.buttons[1].pressed);
      btnX.classList.toggle("active", frame.buttons[2].pressed);

      // Update status display
      let pressed = [];
      frame.buttons.forEach((btn, i) => {
        if (btn.pressed) pressed.push("Button " + i);
      });
      if (pressed.length > 0) {
        status.textContent = "Ghost: " + pressed.join(", ");
      }

      frameIndex++;
    }

    // Continue loop if there are more frames
    if (frameIndex < frames.length) {
      requestAnimationFrame(step);
    } else {
      console.log("Replay finished.");
      status.textContent = "Replay complete";
    }
  }

  // Start the replay
  step();
});
To make debugging a bit more hands-on, I added a ghost replay. Once you’ve recorded a session, you can hit replay and watch the UI act it out, almost like a phantom player is running the pad. A new Replay Ghost button shows up in the panel for this.
Hit Record, mess around with the controller a bit, stop, then replay. The UI just echoes everything you did, like a ghost following your inputs.
Why bother with these extras?
- Recording/export makes it easy for testers to show exactly what happened.
- Snapshots freeze a moment in time, super useful when you’re chasing odd bugs.
- Ghost replay is great for tutorials, accessibility checks, or just comparing control setups side by side.
At this point, it’s not just a neat demo anymore, but something you could actually put to work.
Real-World Use Cases
Now we’ve got this debugger that can do a lot. It shows live input, records logs, exports them, and even replays stuff. But the real question is: who actually cares? Who’s this useful for?
Game Developers
Controllers are part of the job, but debugging them? Usually a pain. Imagine you’re testing a fighting game combo, like ↓ → + punch. Instead of praying, you pressed it the same way twice, you record it once, and replay it. Done. Or you swap JSON logs with a teammate to check if your multiplayer code reacts the same on their machine. That’s huge.
Accessibility Practitioners
This one’s close to my heart. Not everyone plays with a “standard” controller. Adaptive controllers throw out weird signals sometimes. With this tool, you can see exactly what’s happening. Teachers, researchers, whoever. They can grab logs, compare them, or replay inputs side-by-side. Suddenly, invisible stuff becomes obvious.
Quality Assurance Testing
Testers usually write notes like “I mashed buttons here and it broke.” Not very helpful. Now? They can capture the exact presses, export the log, and send it off. No guessing.
Educators
If you’re making tutorials or YouTube vids, ghost replay is gold. You can literally say, “Here’s what I did with the controller,” while the UI shows it happening. Makes explanations way clearer.
Beyond Games
And yeah, this isn’t just about games. People have used controllers for robots, art projects, and accessibility interfaces. Same issue every time: what is the browser actually seeing? With this, you don’t have to guess.
Conclusion
Debugging a controller input has always felt like flying blind. Unlike the DOM or CSS, there’s no built-in inspector for gamepads; it’s just raw numbers in the console, easily lost in the noise.
With a few hundred lines of HTML, CSS, and JavaScript, we built something different:
- A visual debugger that makes invisible inputs visible.
- A layered CSS system that keeps the UI clean and debuggable.
- A set of enhancements (recording, exporting, snapshots, ghost replay) that elevate it from demo to developer tool.
This project shows how far you can go by mixing the Web Platform’s power with a little creativity in CSS Cascade Layers.
The tool I just explained in its entirety is open-source. You can clone the GitHub repo and try it for yourself.
But more importantly, you can make it your own. Add your own layers. Build your own replay logic. Integrate it with your game prototype. Or even use it in ways I haven’t imagined. For teaching, accessibility, or data analysis.
At the end of the day, this isn’t just about debugging gamepads. It’s about shining a light on hidden inputs, and giving developers the confidence to work with hardware that the web still doesn’t fully embrace.
So, plug in your controller, open up your editor, and start experimenting. You might be surprised at what your browser and your CSS can truly accomplish.
(gg, yk)