
Authors: Madhuri Kulkarni, Anand Surana, and Sudeshna Guhaneogi
Imagine skipping the hours-long wait for your favorite amusement park ride by knowing when peak riding times are? Or how about having an itinerary that accounts for everyone’s favorite park activity? Ready for a wild ride? This post reveals how SAS can turbocharge your amusement park adventure! Leveraging the combined strengths of SAS Optimization, SAS Visual Analytics, and the robust capabilities of SAS Studio—powered by SAS Viya, we deliver benefits not only to park visitors but also to park operators.
Strategic Planning for a Seamless Experience
Amusement parks are all about fun, excitement, and creating unforgettable memories with family and friends. From action-packed roller coasters to kid-friendly rides, live shows, games, and delicious snacks, there’s something for everyone to enjoy. Each park has its own unique atmosphere, but all share the promise of a day filled with thrills and laughter.
However, fitting everything into a single day can be a real challenge. Popular attractions often have waiting times exceeding an hour, making it frustrating to stand in line for a ride that lasts only a few minutes. On weekends, holidays, and during peak seasons, large crowds slow down movement between attractions, making it difficult to find short lines. Unfavorable weather—such as heavy rain or extreme heat—can also significantly affect the experience, especially if you aren’t prepared.
With limited park hours and a wide variety of experiences available, you must carefully choose what to prioritize. You can waste time on long walks, backtracking, or standing in unnecessary queues. One of the biggest challenges is planning a route through the park that suits your interests and preferences. Without a clear strategy or map, it’s easy to miss out on major attractions or spend too much time navigating the park inefficiently.
Approach: Leveraging technology for optimal enjoyment
To address this planning challenge, we propose a solution that uses machine learning and optimization techniques. By analyzing historical data, weather forecasts, holiday schedules, and other relevant factors, our model predicts queue times for each attraction at regular intervals throughout the day. The optimization model uses these predictions to generate personalized itineraries tailored to each user’s preferences. All this can ensure a more satisfying and efficient park experience.
Solution: A user-friendly interface for personalized itineraries
We have developed a user-friendly interface that leverages step-based prompts within the Job Definition framework. This solution enables you to define preferences in SAS Visual Analytics and execute an optimization algorithm to generate a personalized, efficient route through the park. Figure 1 illustrates this.
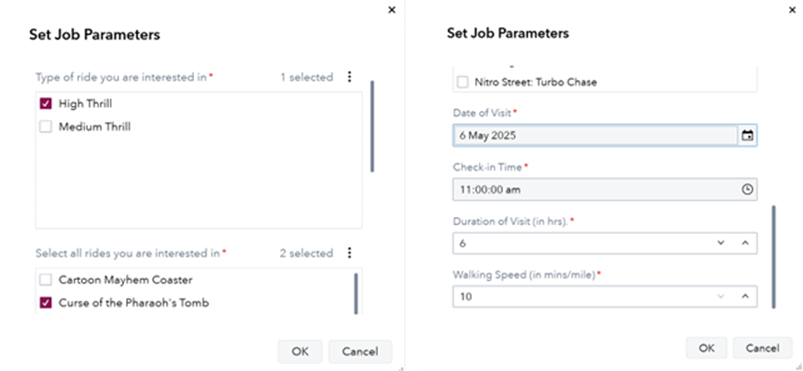
By specifying the following key preferences, you can tailor your visit to match your interests and constraints.
- Select Ride Type: Choose your preferred ride intensity—High Thrill, Medium Thrill, or both—based on your personal interests.
- Select Rides: After selecting a ride type, a list of matching attractions will be displayed. From this list, choose the rides you would like to include in your personalized itinerary.
- Select Date of Visit: Specify the date on that you plan to visit the amusement park. This enables the system to account for expected crowd levels.
- Check-in Time: Enter the time you expect to arrive at the park. This serves as the starting point for planning your itinerary.
- Duration of Visit: Indicate how many hours you intend to spend in the park. The itinerary will be tailored to fit within this time frame.
- Walking Speed: Provide your average walking speed in minutes per mile. This input helps estimate travel time between attractions, ensuring a more accurate and realistic schedule.
Output: Generating the perfect itinerary
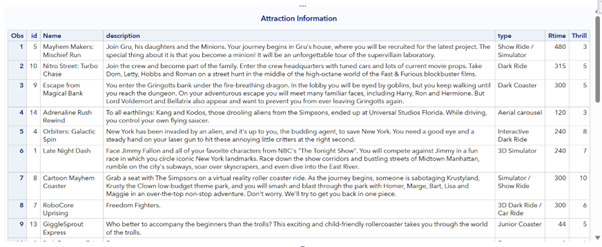
Once all parameters are specified, click the “OK” button. Based on the provided inputs, the system populates the relevant data sets. This includes the following:
- Attraction Details: Information about the selected rides, including name, features, thrill value, estimated ride duration, and location details. Figure 2 illustrates an example.
- Walking Times: Travel times between the selected attractions, calculated by using the specified walking speed.
- Predicted Wait Times: Estimated queue times for each selected attraction on the specified date, based on historical data and contextual factors.
Using this data, the optimization model is developed using the OPTMODEL Procedure in SAS with the Mixed Integer Linear Programming (MILP) solver. It generates a personalized itinerary based on your preferences.
Key Components of the Model
- Decision Variables:
- Binary variables Go[i, j, t] indicate whether attraction j is visited immediately after attraction i, starting at time t.
- Variables for the start times of each attraction.
- Objective Function:
- Maximize the total thrill score for selected attractions.
- Constraints:
- User Preference: The system dynamically defines the optimization constraints based on the above input parameters, such as time constraints, ride selection, and others.
- Sequence constraints: Avoid overlapping times. If the binary variable Go[i, j, t] =1, then attraction i should be visited before attraction j.
- Output:
- Optimal route through the park.
- Recommended start times for each attraction.
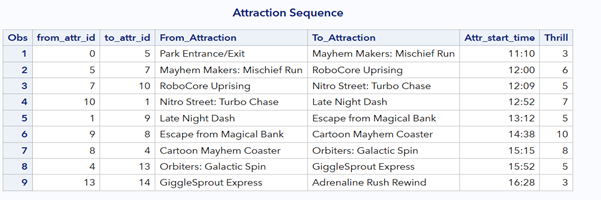
The optimized itinerary and route, including attraction order and recommended start times, are displayed in a tabular format in Figure 3. Figure 4 is in the form of a geo-network graph.

Summary
In this post, we explored how SAS Viya combines the advanced capabilities of SAS Optimization to address complex planning challenges. SAS Studio streamlines and enhances customer experience design. And SAS Visual Analytics brings insights to life through compelling visualizations. We integrate these powerful tools to show how you can optimize your amusement park visit. This can range from reducing wait times to improving resource allocation. This ultimately creates a more enjoyable and efficient experience!
Moreover, the methodologies discussed not only enable better decision-making but also offer a scalable approach to managing large-scale operations. With thoughtful planning and the right analytical tools, park administrators can deliver seamless, memorable experiences that delight visitors and drive operational excellence.
Anand Surana
Anand Surana is a Senior Associate Data Scientist in the SAS Pune Applied AI and Modeling Division. His areas of expertise include forecasting, generative AI, and computer vision. He has contributed to several models, prototypes, and solutions across diverse industries, including insurance, retail, and supply chain. Anand holds an M.Sc. from Savitribai Phule Pune University, India.
Sudeshna Guhaneogi
Sudeshna Guhaneogi is a Senior Manager in the SAS Pune Applied AI and Modeling Division. She brings over 21 years of experience driving data-driven innovation across various industries, including investment banking, insurance, healthcare, supply chain, retail, CPG, manufacturing, IoT, and energy. She holds an MSc in Statistics from Calcutta University and specializes in advanced AI/ML, including generative and agentic AI, forecasting, optimization, and stochastic modeling. Sudeshna leads a team of data scientists in India, developing cutting-edge analytical models for diverse sectors.